Refer to the Exhibit.
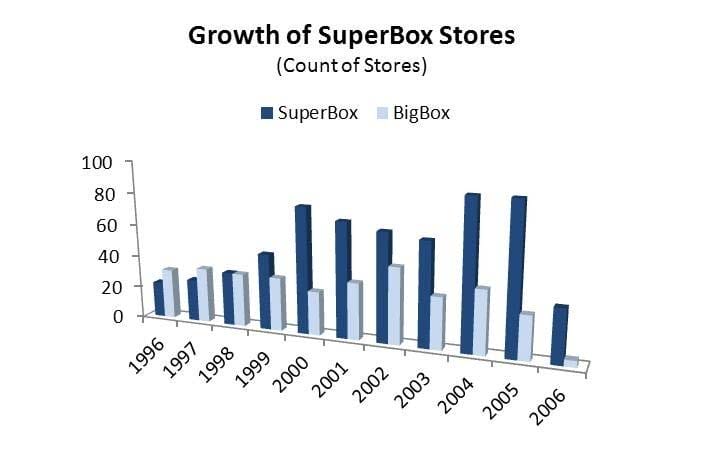
In the Exhibit. For effective visualization, what is the chart's primary flaw?
A. The use of 3 dimensions.
B. The slanting of axis labels.
C. The location of the legend.
D. The order of the columns.
What is the output format from the Map function of MapReduce?
A. Key-value pairs
B. Binary representation of keys concatenated with structured data
C. Compressed index
D. Unique key record and separate records of all possible values
When is a Wilcoxon Rank-Sum test used?
A. When an assumption about the distribution of the populations cannot be made
B. When the data can be easily sorted
C. When the populations represent the sums of other values
D. When the data cannot be easily sorted
When creating a presentation for a technical audience, what is the main objective?
A. Show that you met the project goals
B. Show how you met the project goals
C. Show if the model will meet the SLA
D. Show the technique to be used in the production environment
Consider a scale that has five (5) values that range from "not important" to "very important". Which data classification best describes this data?
A. Ordinal
B. Nominal
C. Real
D. Ratio
Refer to the Exhibit.
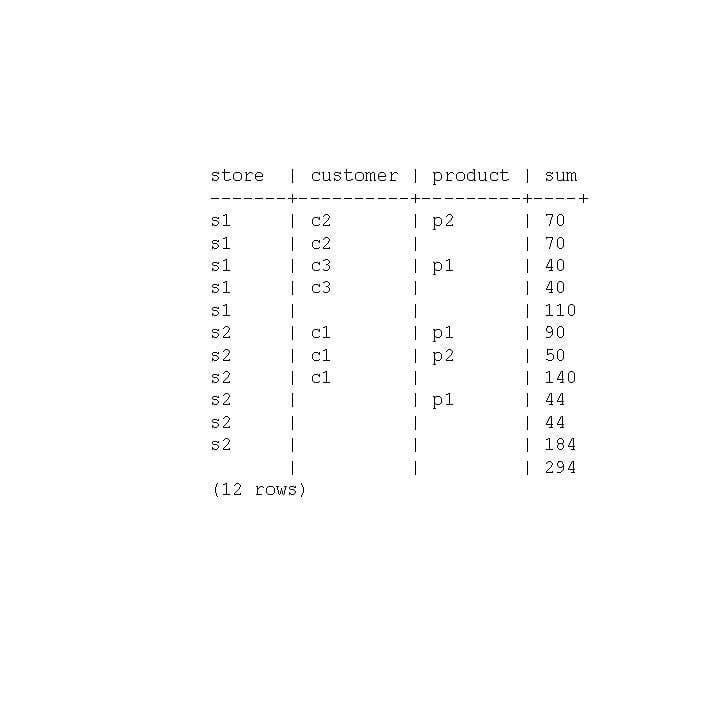
You are working on creating an OLAP query that outputs several rows of with summary rows of subtotals and grand totals in addition to regular rows that may contain NULL as shown in the exhibit. Which function can you use in your query to distinguish the row from a regular row to a subtotal row?
A. GROUPING
B. RANK
C. GROUP_ID
D. ROLLUP
What are the characteristics of Big Data?
A. Data volume, processing complexity, and data structure variety.
B. Data volume, business importance, and data structure variety.
C. Data type, processing complexity, and data structure variety.
D. Data volume, processing complexity, and business importance.
Since R factors are categorical variables, they are most closely related to which data classification level?
A. nominal
B. ordinal
C. interval
D. ratio
Which R data structure allows elements to have different data types?
A. List
B. Vector
C. Matrix
D. Array
You are building a logistic regression model to predict whether a tax filer will be audited within the next two years. Your training set population is 1000 filers. The audit rate in your training data is 4.2%. What is the sum of the probabilities that the model assigns to all the filers in your training set that have been audited?
A. 42.0
B. 4.2
C. 0.42
D. 0.042