You are analyzing a time series and want to determine its stationarity. You also want to determine the
order of autoregressive models.
How are the autocorrelation functions used?
A. ACF as an indication of stationarity,and PACF for the correlation between Xt and Xt-k not explained by their mutual correlation with X1 through Xk-1.
B. PACF as an indication of stationarity,and ACF for the correlation between Xt and Xt-k not explained by their mutual correlation with X1 through Xk-1.
C. ACF as an indication of stationarity,and PACF to determine the correlation of X1 through Xk-1.
D. PACF as an indication of stationarity,and ACF to determine the correlation of X1 through Xk-1.
What is one modeling or descriptive statistical function in MADlib that is typically not provided in a standard relational database?
A. Linear regression
B. Expected value
C. Variance
D. Quantiles
You have used k-means clustering to classify behavior of 100, 000 customers for a retail store. You decide to use household income, age, gender and yearly purchase amount as measures. You have chosen to use 8 clusters and notice that 2 clusters only have 3 customers assigned. What should you do?
A. Decrease the number of clusters
B. Increase the number of clusters
C. Decrease the number of measures used
D. Identify additional measures to add to the analysis
Which word or phrase completes the statement? Unix is to bash as Hadoop is to:
A. Pig
B. HDFS
C. Sqoop
D. NameNode
You are studying the behavior of a population, and you are provided with multidimensional data at the individual level. You have identified four specific individuals who are valuable to your study, and would like to find all users who are most similar to each individual. Which algorithm is the most appropriate for this study?
A. K-means clustering
B. Linear regression
C. Association rules
D. Decision trees
What are the characteristics of Big Data?
A. Data volume,processing complexity,and data structure variety.
B. Data volume,business importance,and data structure variety.
C. Data type,processing complexity,and data structure variety.
D. Data volume,processing complexity,and business importance.
You are analyzing data in order to build a classifier model. You discover non-linear data and discontinuities that will affect the model. Which analytical method would you recommend?
A. Decision Trees
B. Logistic Regression
C. ARIMA
D. Linear Regression
You are provided four different datasets. Initial analysis on these datasets show that they have identical mean, variance and correlation values. What should your next step in the analysis be?
A. Visualize the data to further explore the characteristics of each data set
B. Select one of the four datasets and begin planning and building a model
C. Combine the data from all four of the datasets and begin planning and bulding a model
D. Recalculate the descriptive statistics since they are unlikely to be identical for each dataset
You have run the association rules algorithm on your data set, and the two rules {banana, apple} => {grape} and {apple, orange}=> {grape} have been found to be relevant. What else must be true?
A. {grape,apple,orange} must be a frequent itemset.
B. {banana,apple,grape,orange} must be a frequent itemset.
C. {grape} => {banana,apple} must be a relevant rule.
D. {banana,apple} => {orange} must be a relevant rule.
Refer to the exhibit.
You have plotted the distribution of savings account sizes for your bank. How would you proceed, based
on this distribution?
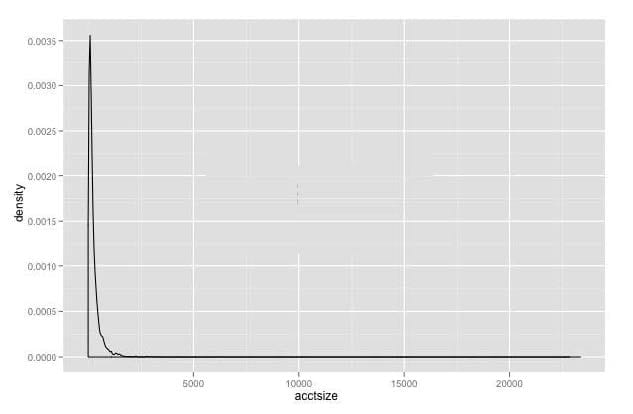
A. The data is extremely skewed. Replot the data on a logarithmic scale to get a better sense of it.
B. The data is extremely skewed,but looks bimodal; replot the data in the range 2,500-10,000 to be sure.
C. The accounts of size greater than 2500 are rare,and probably outliers. Eliminate them from your future analysis.
D. The data is extremely skewed. Split your analysis into two cohorts: accounts less than 2500,and accounts greater than 2500