For a variable salary we have the statistics as shown in the figure below.
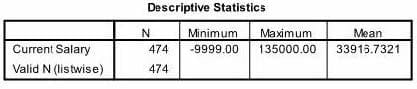
The reported Mean is incorrect because a value, -9999, is included in its calculation. How can this situation be fixed?
A. Define -9999 as a system-missing value.
B. Remove allcases with the value -9999 for the variable salary from the data file.
C. Define -9999 as a user-missing value.
D. Define -9999 as both a system- and user-missing value.
In order to access the New Custom Attribute feature in the Data Editor, the Data Editor must be viewed from the:
A. Value Labels button.
B. Dialog Recall button.
C. Data View tab.
D. Variable View tab.
Which operations are available from the File menu? (Choose three.)
A. Open and Save data files
B. Print the contents of the active IBM SPSS Statistics window
C. Exit IBM SPSS Statistics
D. Run the FREQUENCIES procedure
A paired samples t4est is different from an independentt-test because it:
A. Assesses each person twice.
B. Compares groups on correlations.
C. Compares groups on means.
D. Compares groups on variances.
What information is contained in the journal file?
A. Information relating to the IBM SPSS Statisticsdata file you are working with
B. Information relating to the IBM SPSS Statistics data file you are working with and any output created
C. Syntax from all operations relating to manipulating variables
D. Syntax from actions taken in dialog boxes or from running commands from the Syntax Editor
Suppose you want to get help on the Cumulative Percent column in a FREQUENCIES table. Using the figure below, how would you do it?
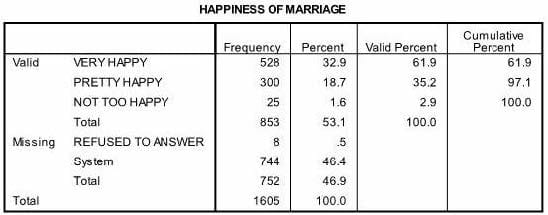
A. Go to Help ... Topics and search for Cumulative Percent.
B. Go to Help ... Command Syntax Reference and search for Cumulative Percent.
C. Go to Help ... About.
D. Double-click the table, right-click Cumulative Percent and select What's this? from the pop-up menu.
IBM SPSS Statistics system variables can be:
A. Used in data transformations.
B. Specified in analysis procedures.
C. Modified using Compute Variable.
D. Viewed in the Data Editor.
Which statement is true about IOR (inter quartile range)? (Choose two.)
A. It is used to measure the spread ofthe data.
B. It is equal to the mode.
C. It is the range between the values at the 25111 and 75111 percentile.
D. It indicates whether the variable is normally distributed or not.
As the sample size increases, the amount of variabilit9 in the distribution of sample means increases.
A. True
B. False
As the sample size increases, the amount of variabilit9 in the distribution of sample means increases.
A. True
B. False